
Analytics Tool for a Workplace Stress Screening Program
Project Overview
The Workplace Stress Screening Analysis Tool allowed HR managers to assess group-level stress but risked losing three clients due to poor usability.
Through user research and interviews with specialists and stakeholders, I identified three key improvements and enhanced the design. This addressed client concerns and resulted in retaining all clients.
- Timeline
- 2 person-months
- Role
- UX/UI Design, UX Research
- Tool
- Figma
- Company
- mediPhone, inc.
- Team
- Engineer 1x, Project Owner 1x, Outside Domain Specialist 1x, Customer Success Representative 1x, Product designer (myself)
- Impacts
- The redesign improved usability, addressed key client concerns, and helped prevent the cancellation of 3 major clients.
*This project was originally created in Japanese for a Japanese audience. The text has been translated into English for this portfolio.
The Situation
The Product
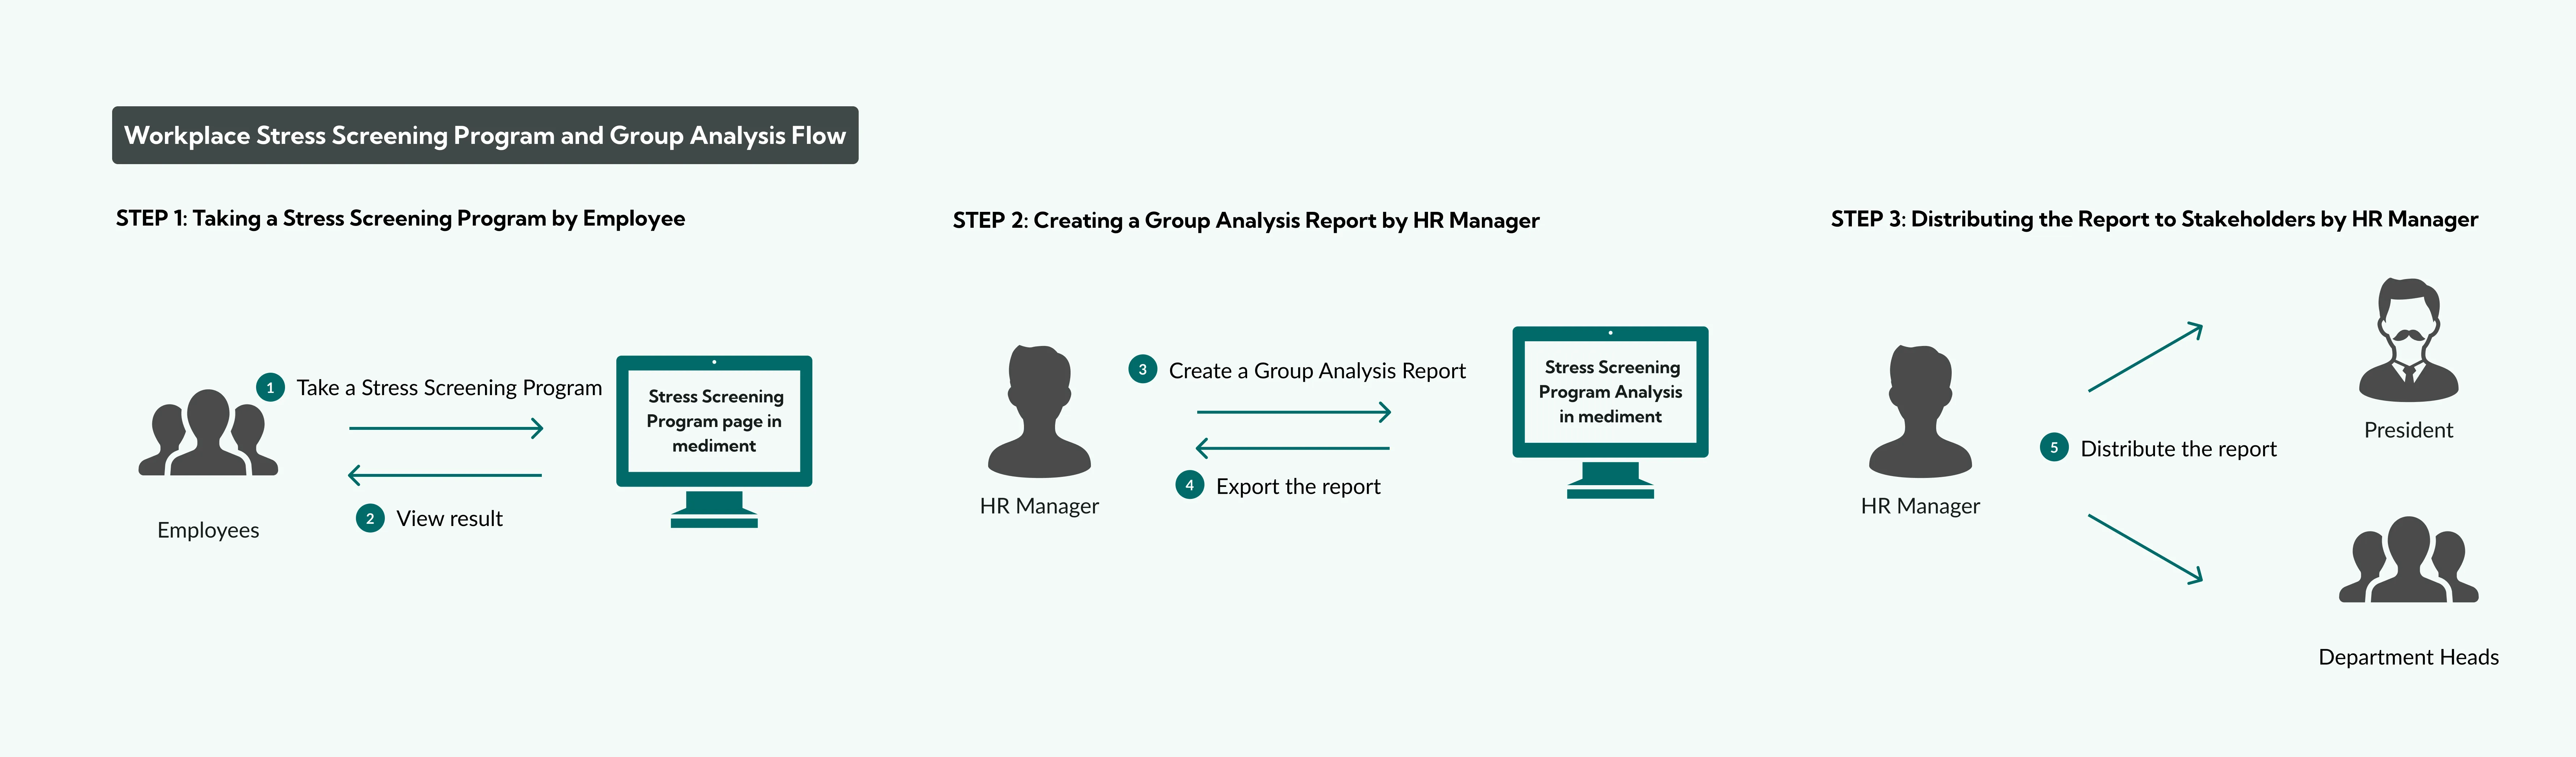
- In Japan, companies must conduct workplace stress checks for employees.
- mediment provides a feature that helps HR managers conduct stress screenings and analyze group-level results.
- It supports workplace improvement based on mental health insights.
Problems
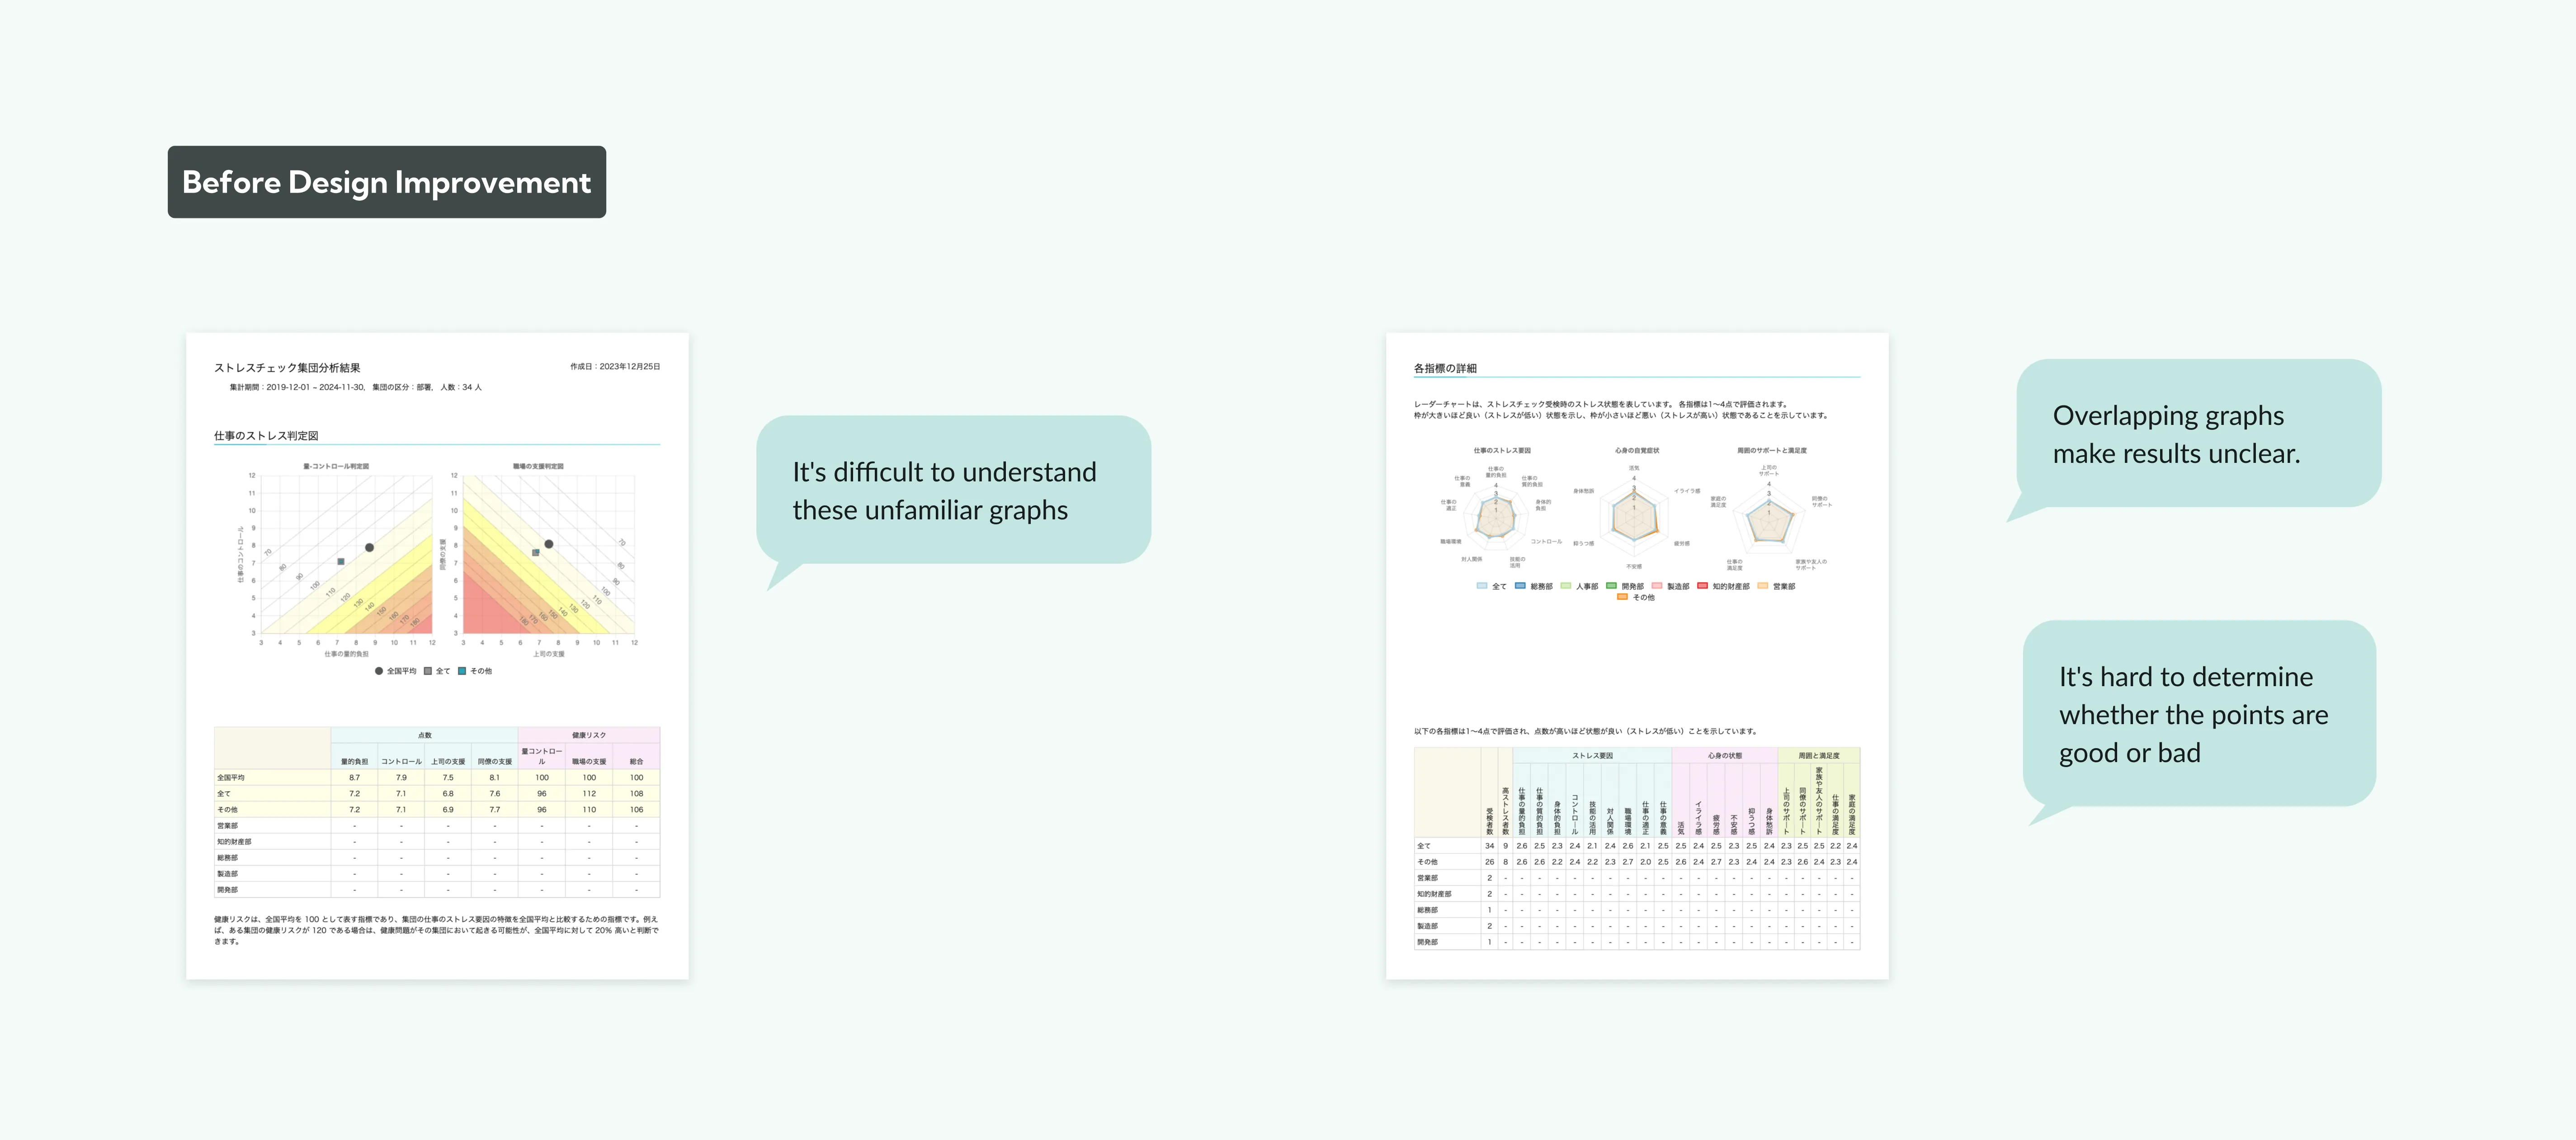
- The current analysis feature is difficult for HR managers and department heads to interpret.
- As a result, they struggle to take effective action based on the data.
- 3 clients considered canceling their contracts due to this usability issue.
Goals
- Enable users to quickly grasp group-level stress analysis at a glance.
- Help HR managers and department heads use insights to improve workplace mental health.
- Retain the 3 clients and attract new ones by enhancing the feature's usability and value.
Constraints
To prevent overwhelming users with excessive results and reduce tasks for HR by ensuring the analysis could be printed on fewer pages, I made sure the department reports were concise, fitting on a single page and focusing on the most essential information.
Solutions
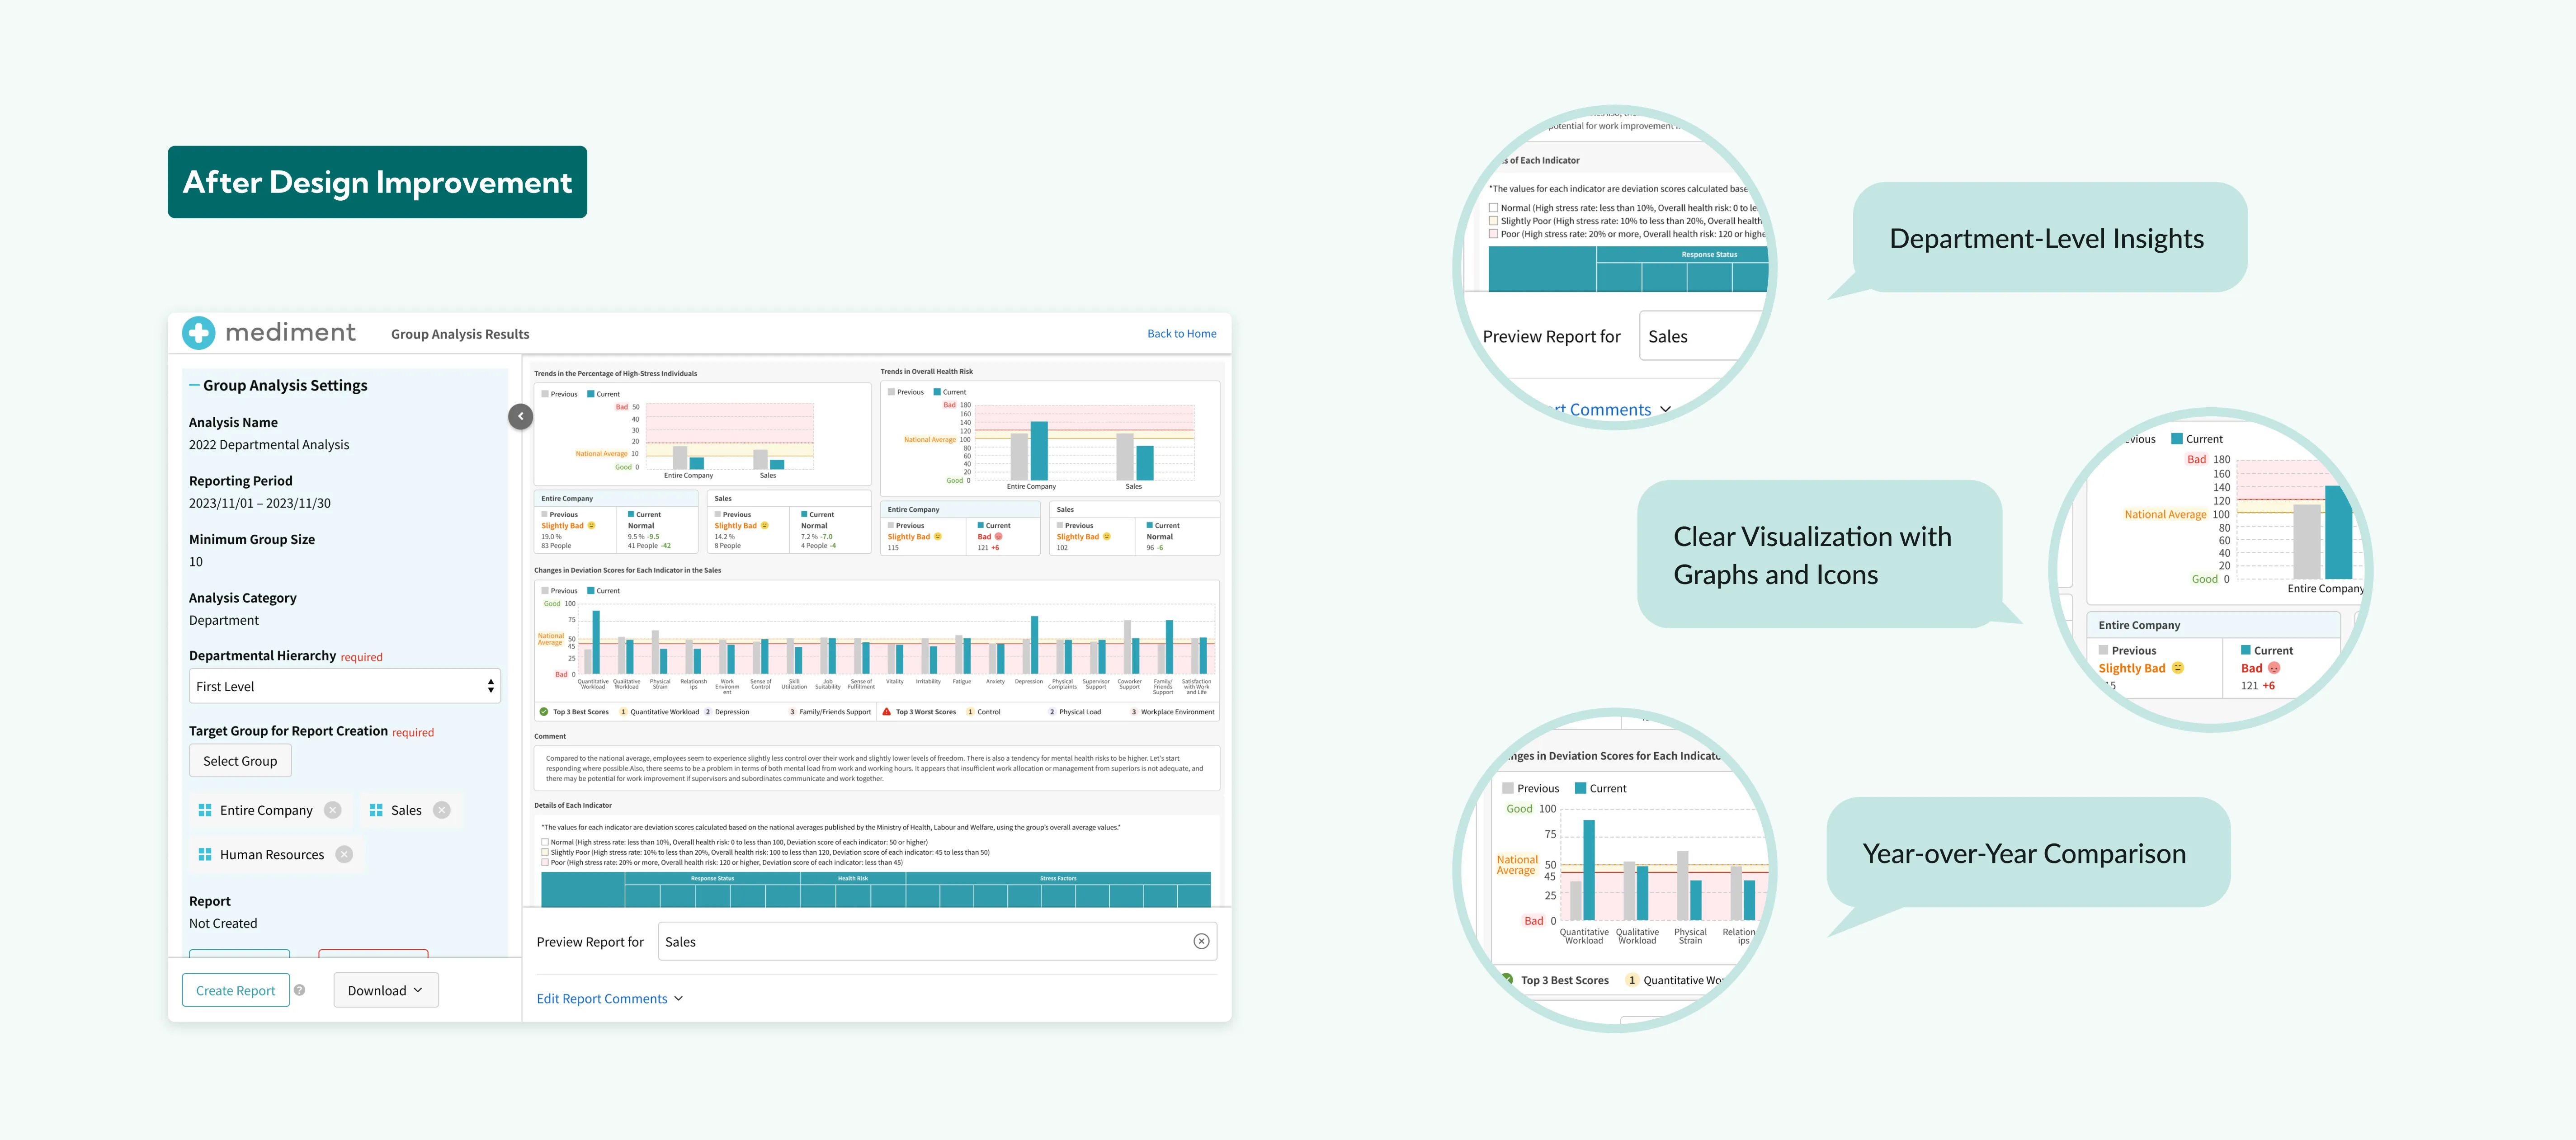
I developed three main solutions:
- Department-Level Insights: In addition to company-wide results, department leaders can now view detailed analysis at the department level, enabling more targeted interventions.
- Clear Visualization with Graphs and Icons: The use of intuitive graphs and icons allows users to quickly understand stress levels and identify key patterns at a glance.
- Year-over-Year Comparison: This feature helps users track subtle trends and changes in stress levels over time, offering valuable insights for long-term health management.
Design Process
I followed a process based on design thinking.

Research
User Interviews
Interviews with Internal Stakeholders
I interviewed the project owner and an internal expert to gather feedback on improvements for mediment's Workplace Stress Screening Features. I organized the feedback into a spreadsheet, prioritizing it based on urgency. A key focus was the group analysis report, which we decided to redesign with the following improvements:
- Making the report clearer using colors, emoticons, and graphs
- Creating two types of reports (company-wide and group breakdown)
- Enabling comparisons with previous results
Interviews with External Experts on the Workplace Stress Screening Program
In addition to the internal interviews, I also interviewed external experts on the Workplace Stress Screening Program. They advised that including the high-stress rate and a health risk portfolio chart in the report would make the overall risks easier for HR Managers and department heads to understand. As a result, I decided to incorporate these elements into the new report design.
Competitive Audit
I researched both direct competitors that offer group analysis features for workplace stress screening programs and indirect competitors that provide stress reporting features using different methods.
| Service | Feature | Strengths | Weaknesses |
|---|---|---|---|
| Dr. Trust | This company offers health management services for employees, including the Workplace Stress Screening Program and group analysis reports. | Reports use colors and graphs for easy understanding and provide a unique score that reflects workplace satisfaction, compared to national results. | The reports are over 20 pages, which may be too long for some companies. |
| Kidsly | Kidsly is a management tool for nurseries and kindergartens that visualizes childcare workers' stress levels. | Stress is summarized in a single-page report, with results from current and previous checks shown through graphs and emoticons. | The simple features may not meet the needs of childcare facilities requiring advanced analysis or customization. |
| Lafool Survey | This survey tool improves organizations by measuring employee engagement and mental health, generating detailed reports. | Survey results are visualized with illustrations and colors for easy understanding. | Results cannot be broken down into individual items, limiting detailed data. |
Ideation
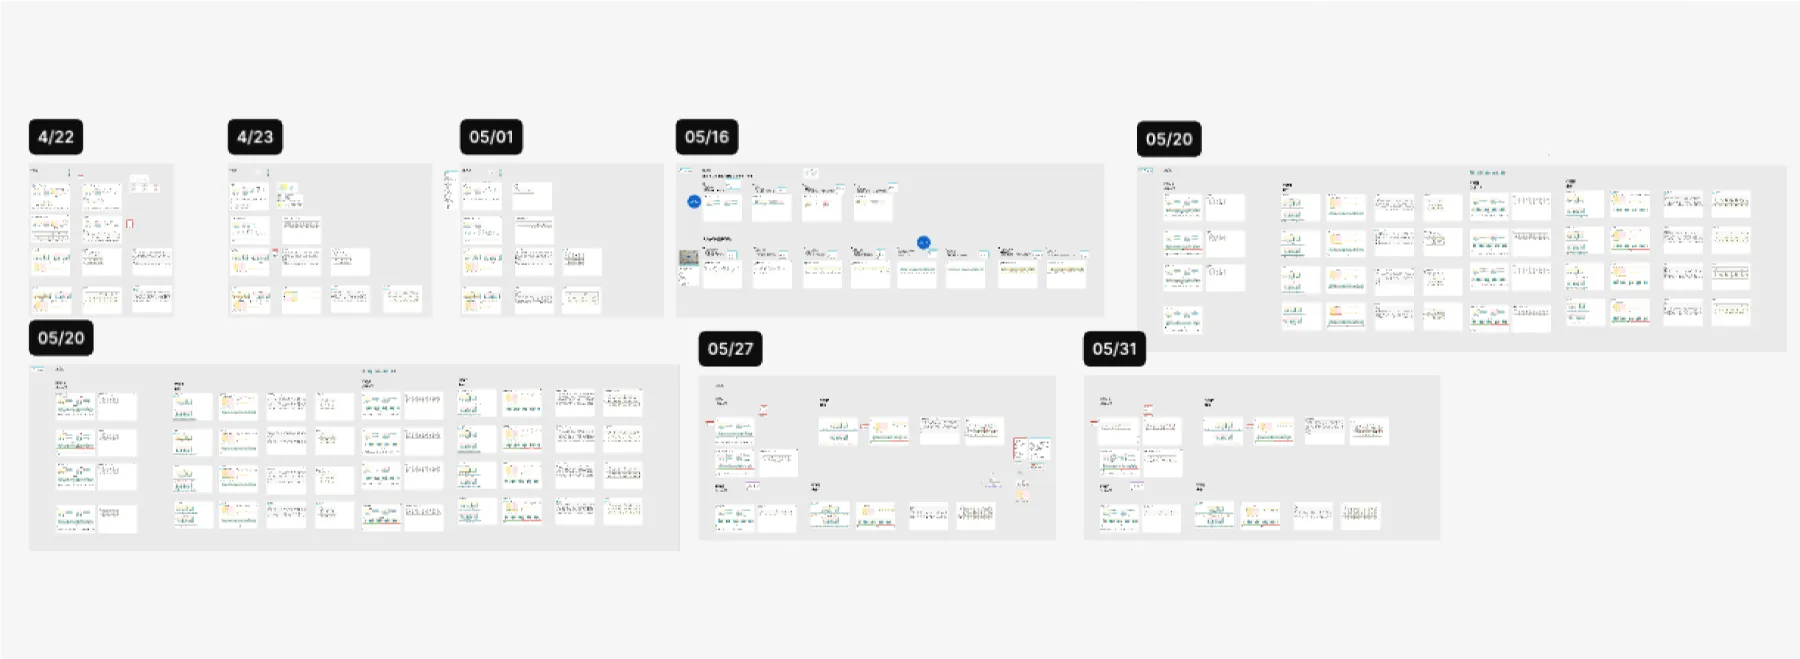
Based on the interview results and competitive research, we brainstormed design ideas. We repeated the process of brainstorming and reviewing the ideas eight times, involving both internal stakeholders and external experts in each round, until we arrived at a design we were satisfied with.
Design
Hi-Fidelity Designs
Based on the ideas, I created Hi-Fi designs. I received advice from internal designers to ensure that even with a large amount of information on the page, it remains easy to read. In addition to the newly designed report, I also made significant improvements to the design of the screen used to generate the group analysis reports.
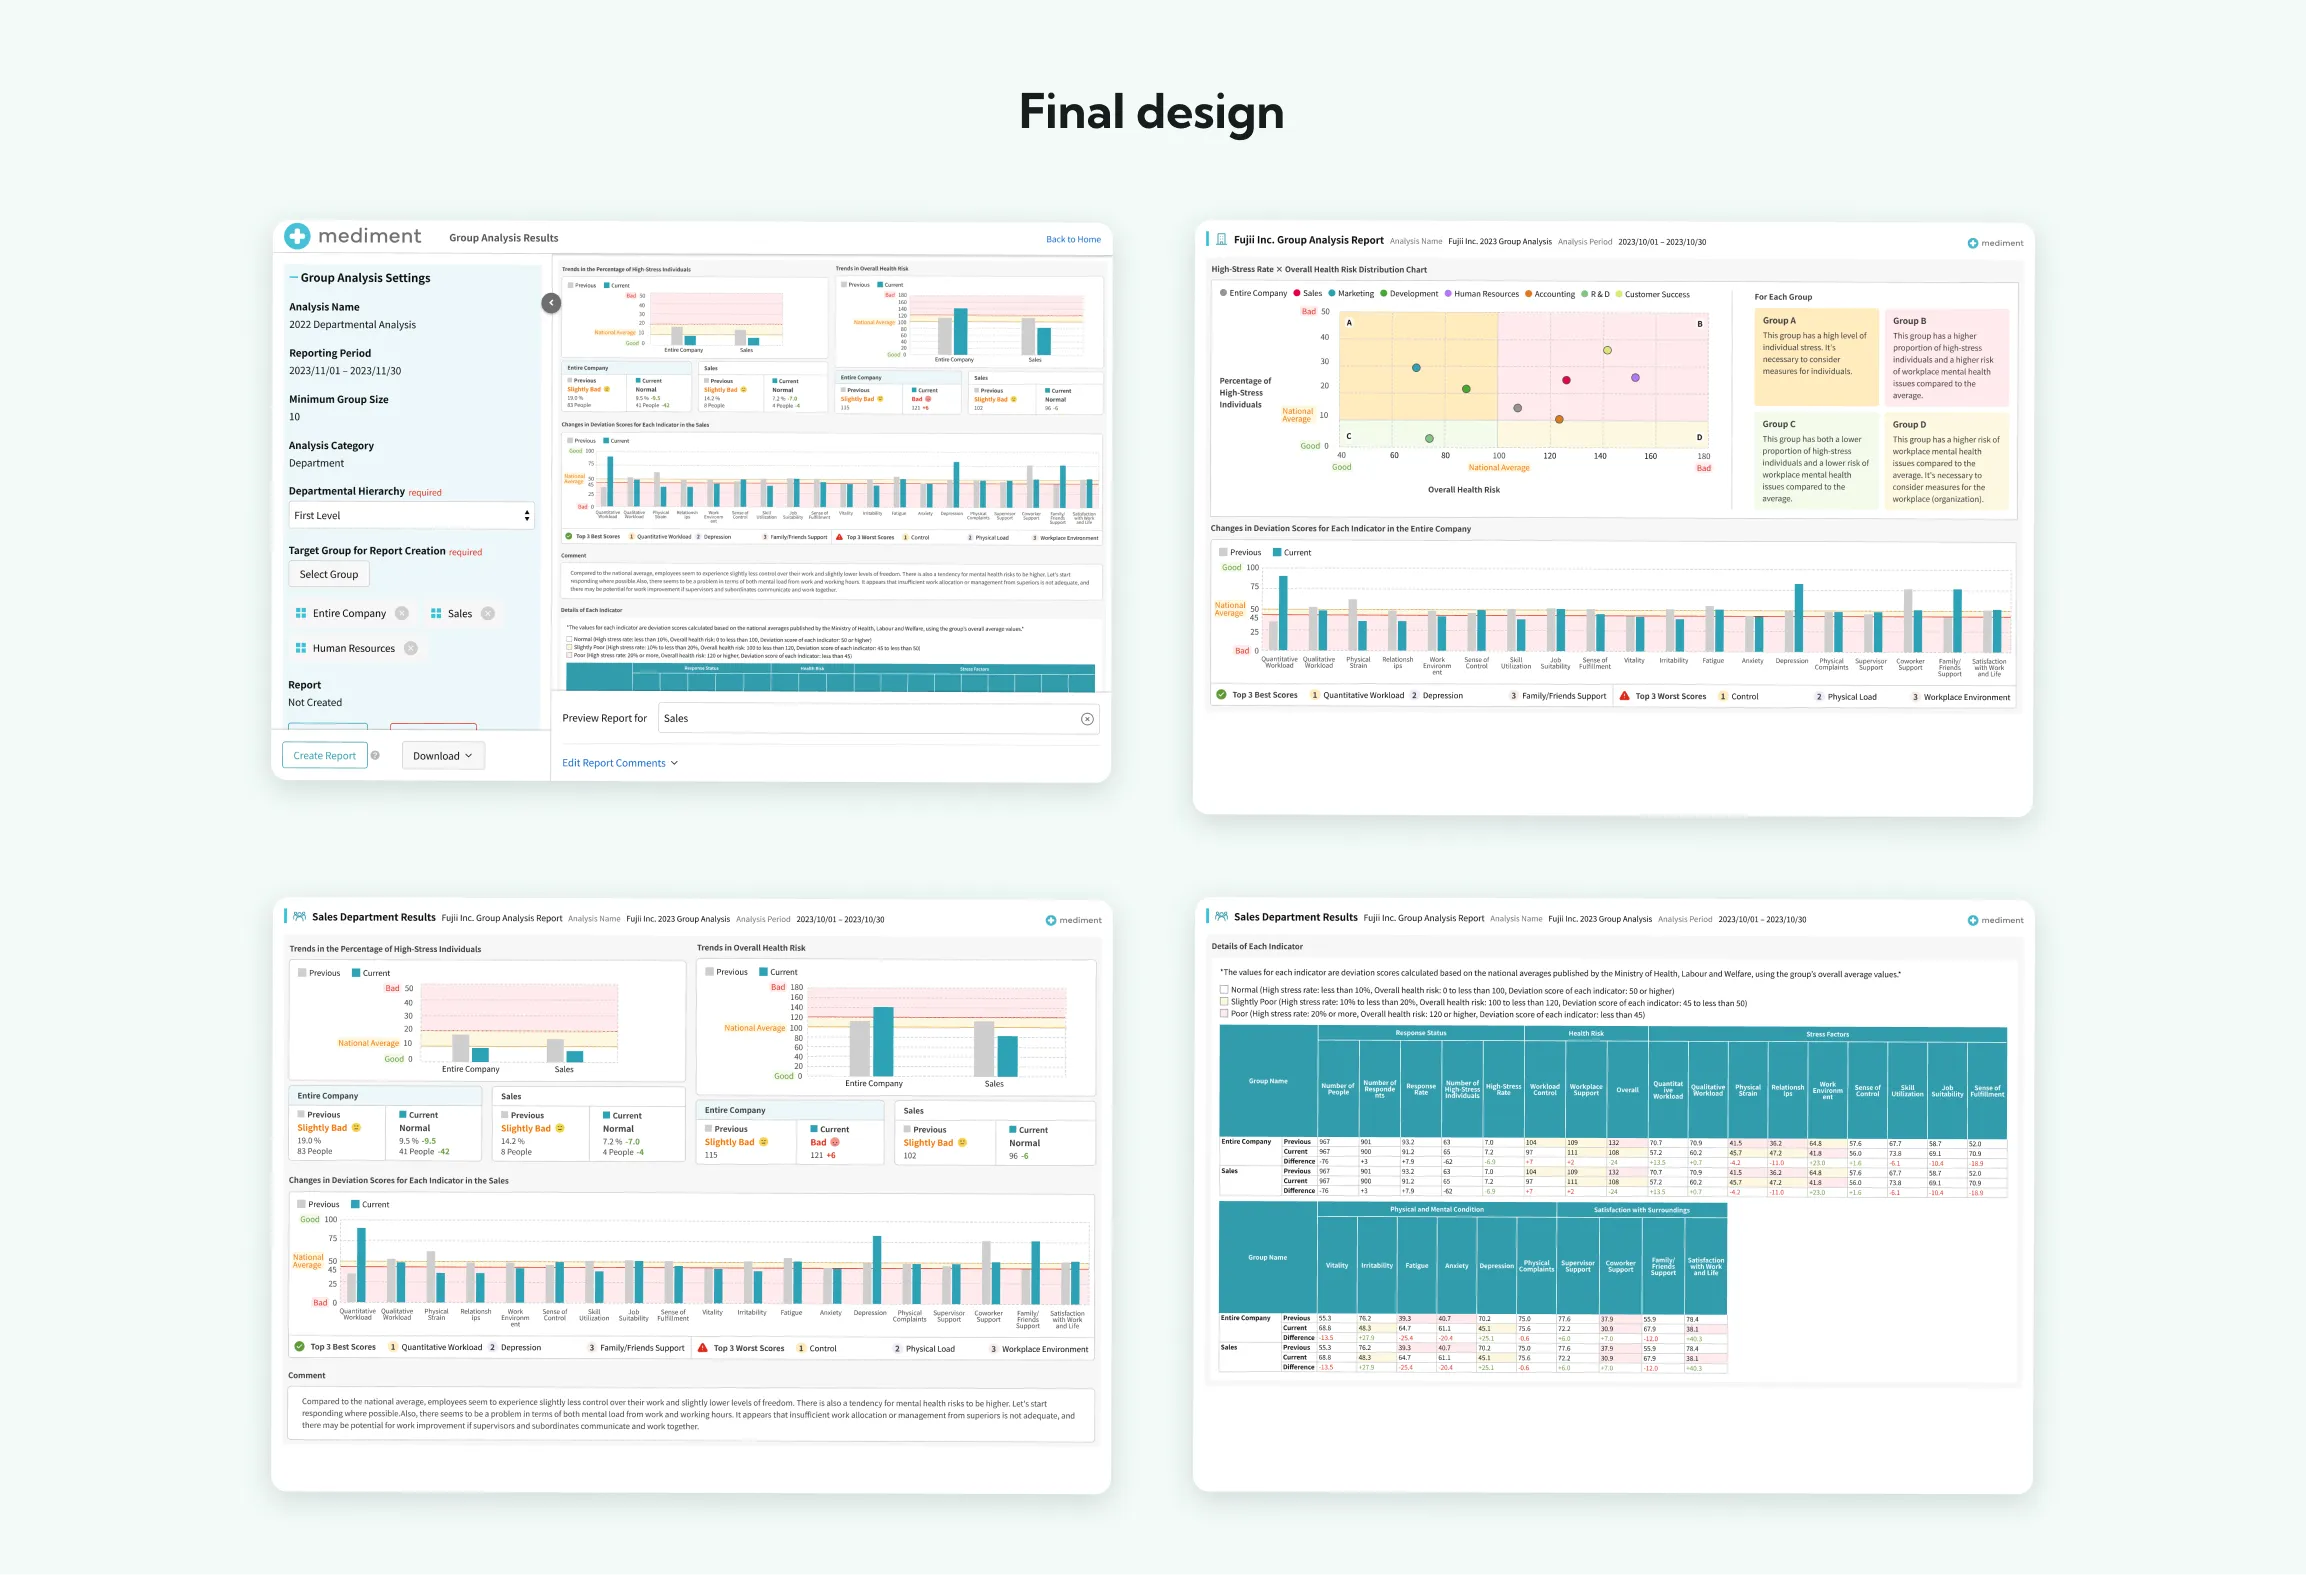
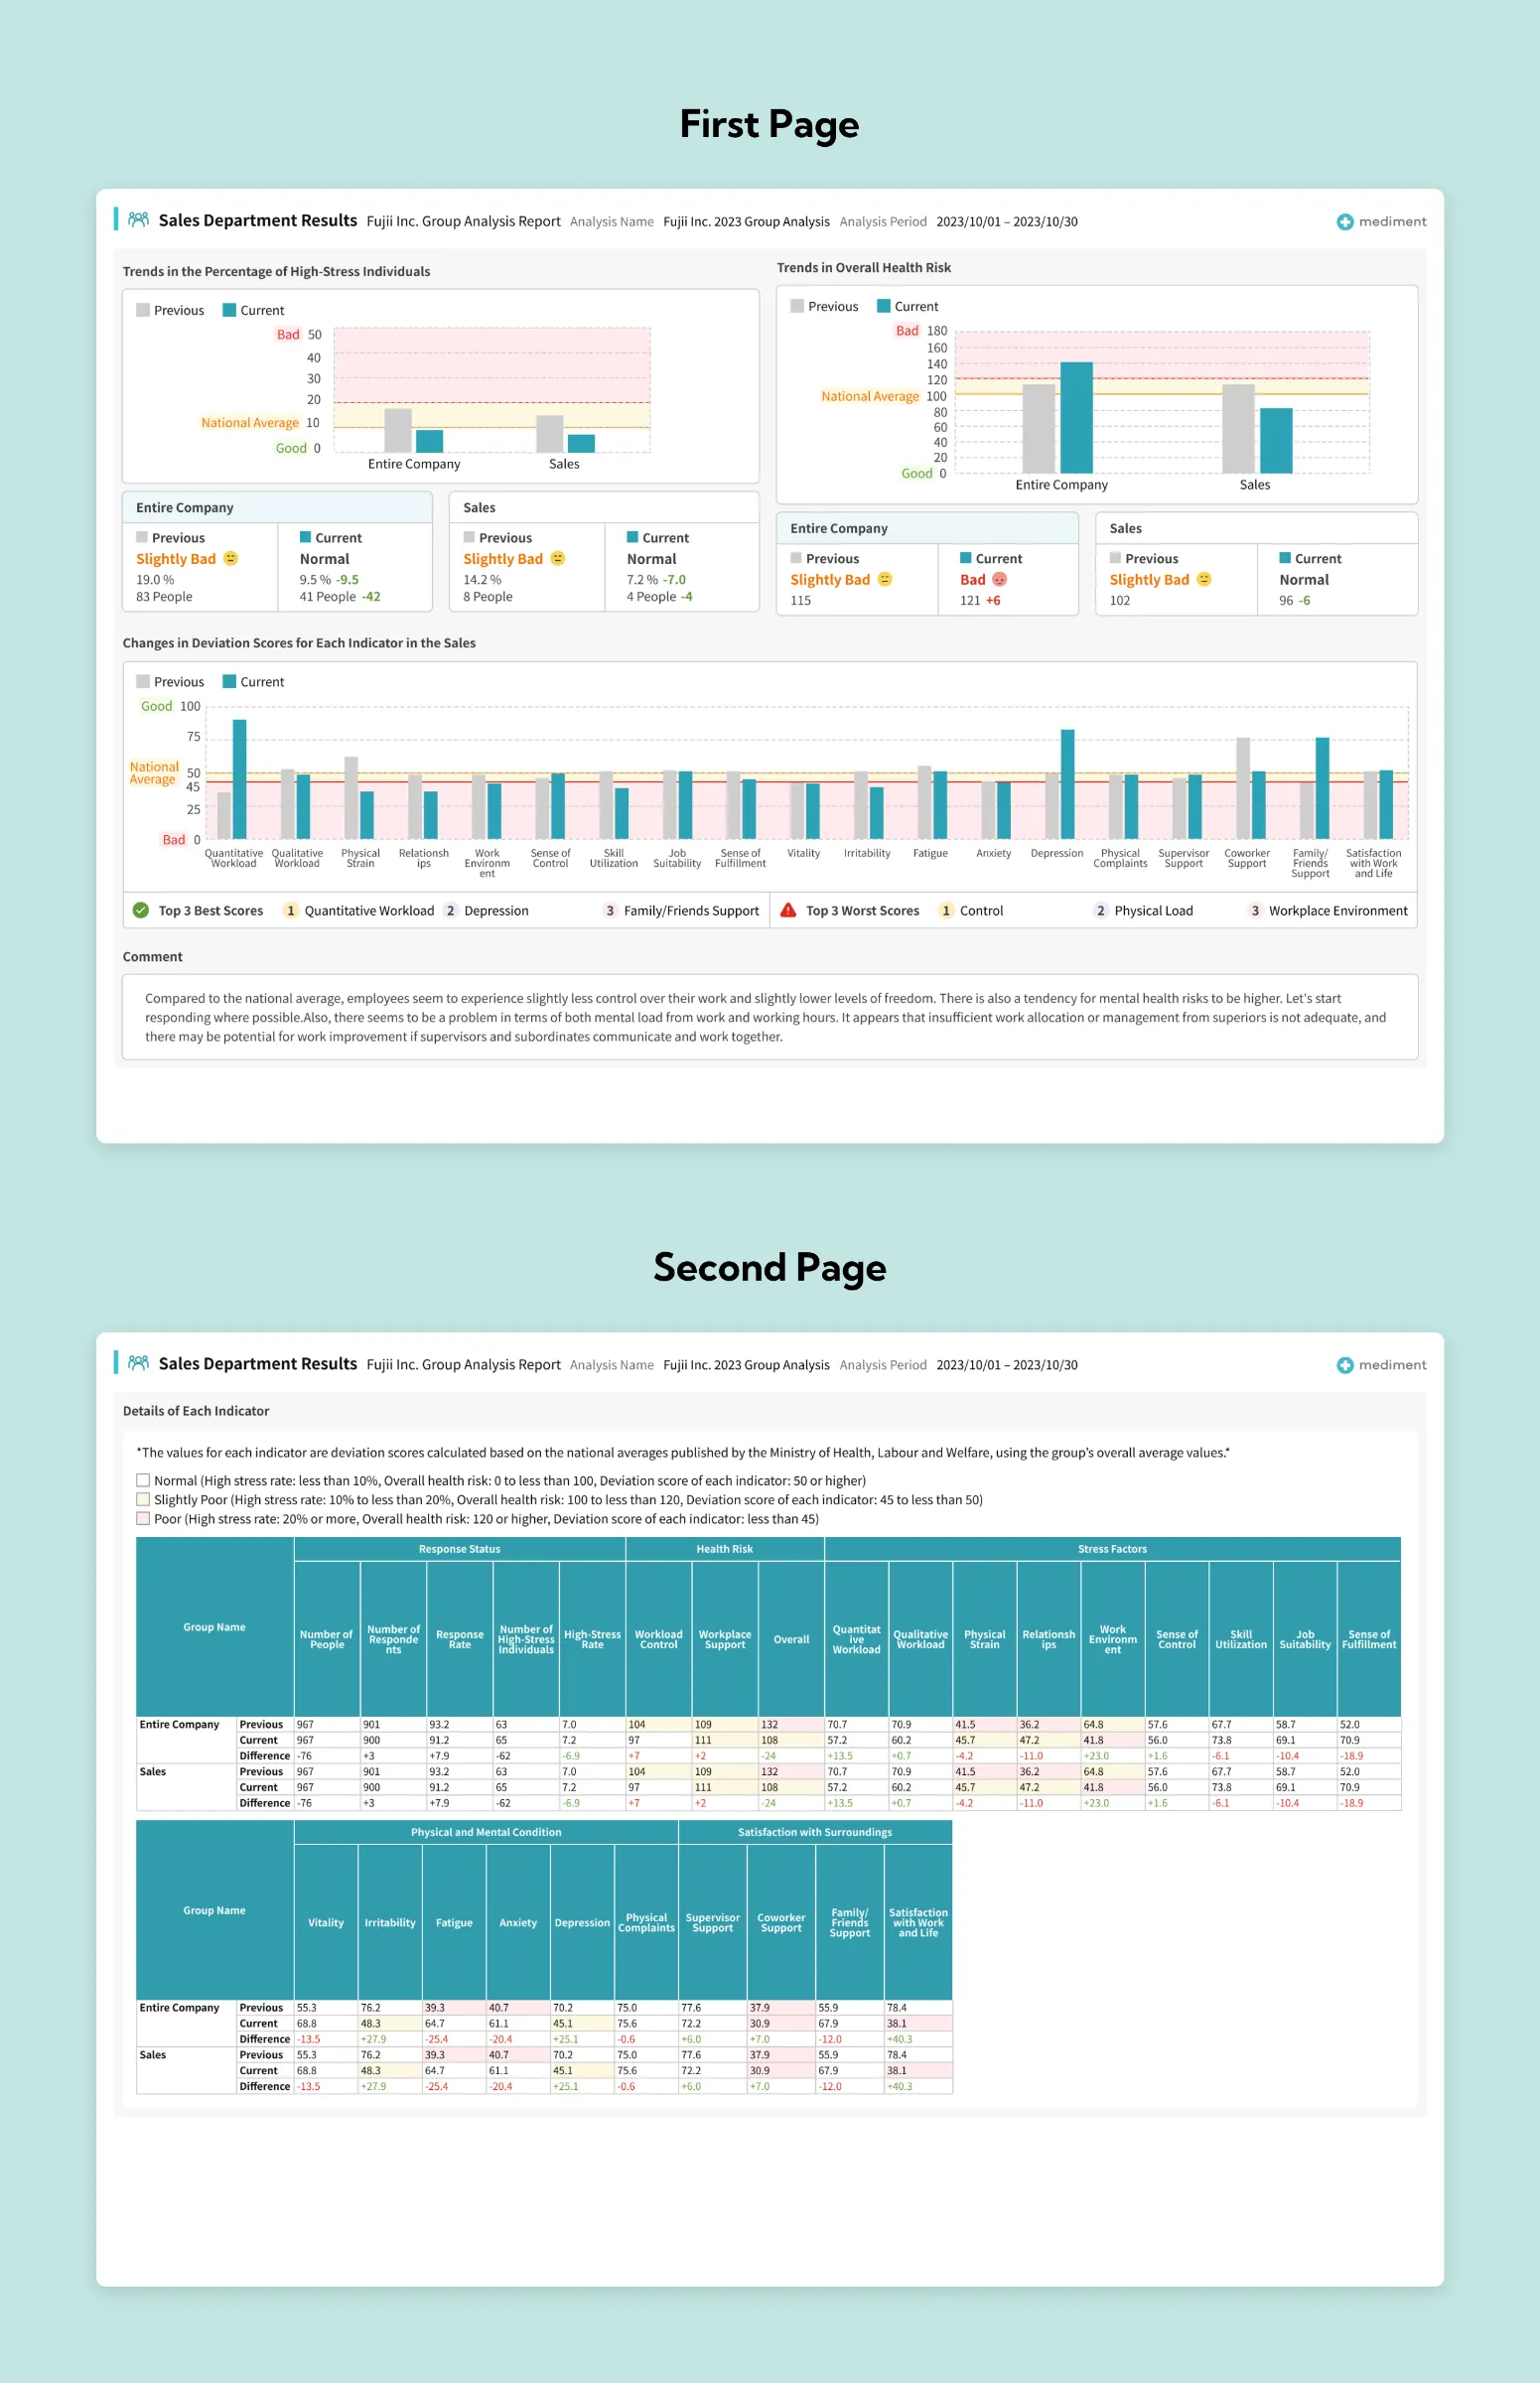
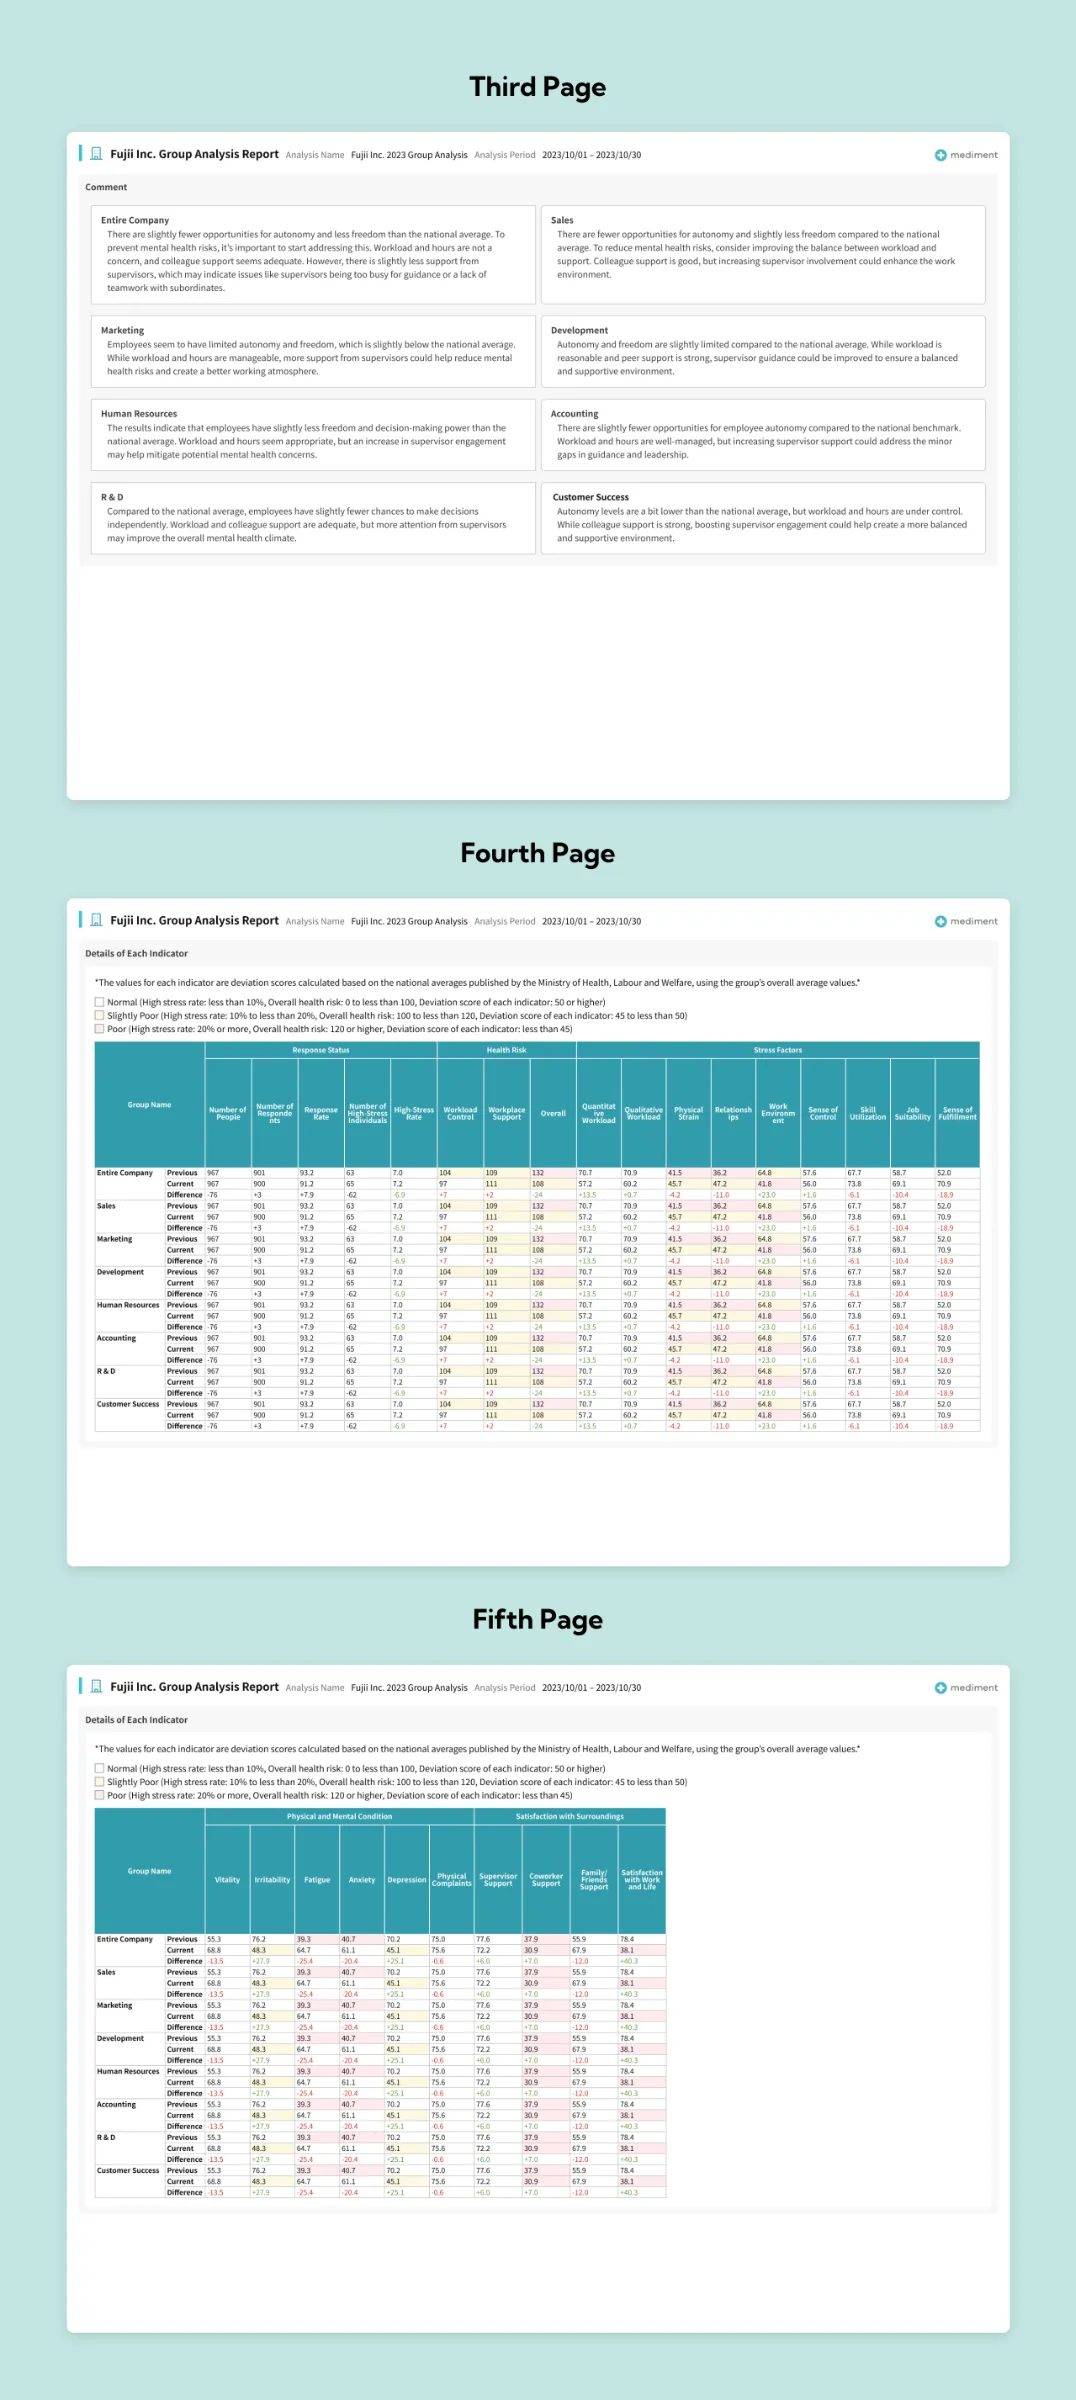
Group Analysis Report by Department (for Department Heads)
On the first page, department heads can easily see how their department's stress levels compare to the overall company, using graphs and emoticons. On the second page, they can review detailed data for each question.
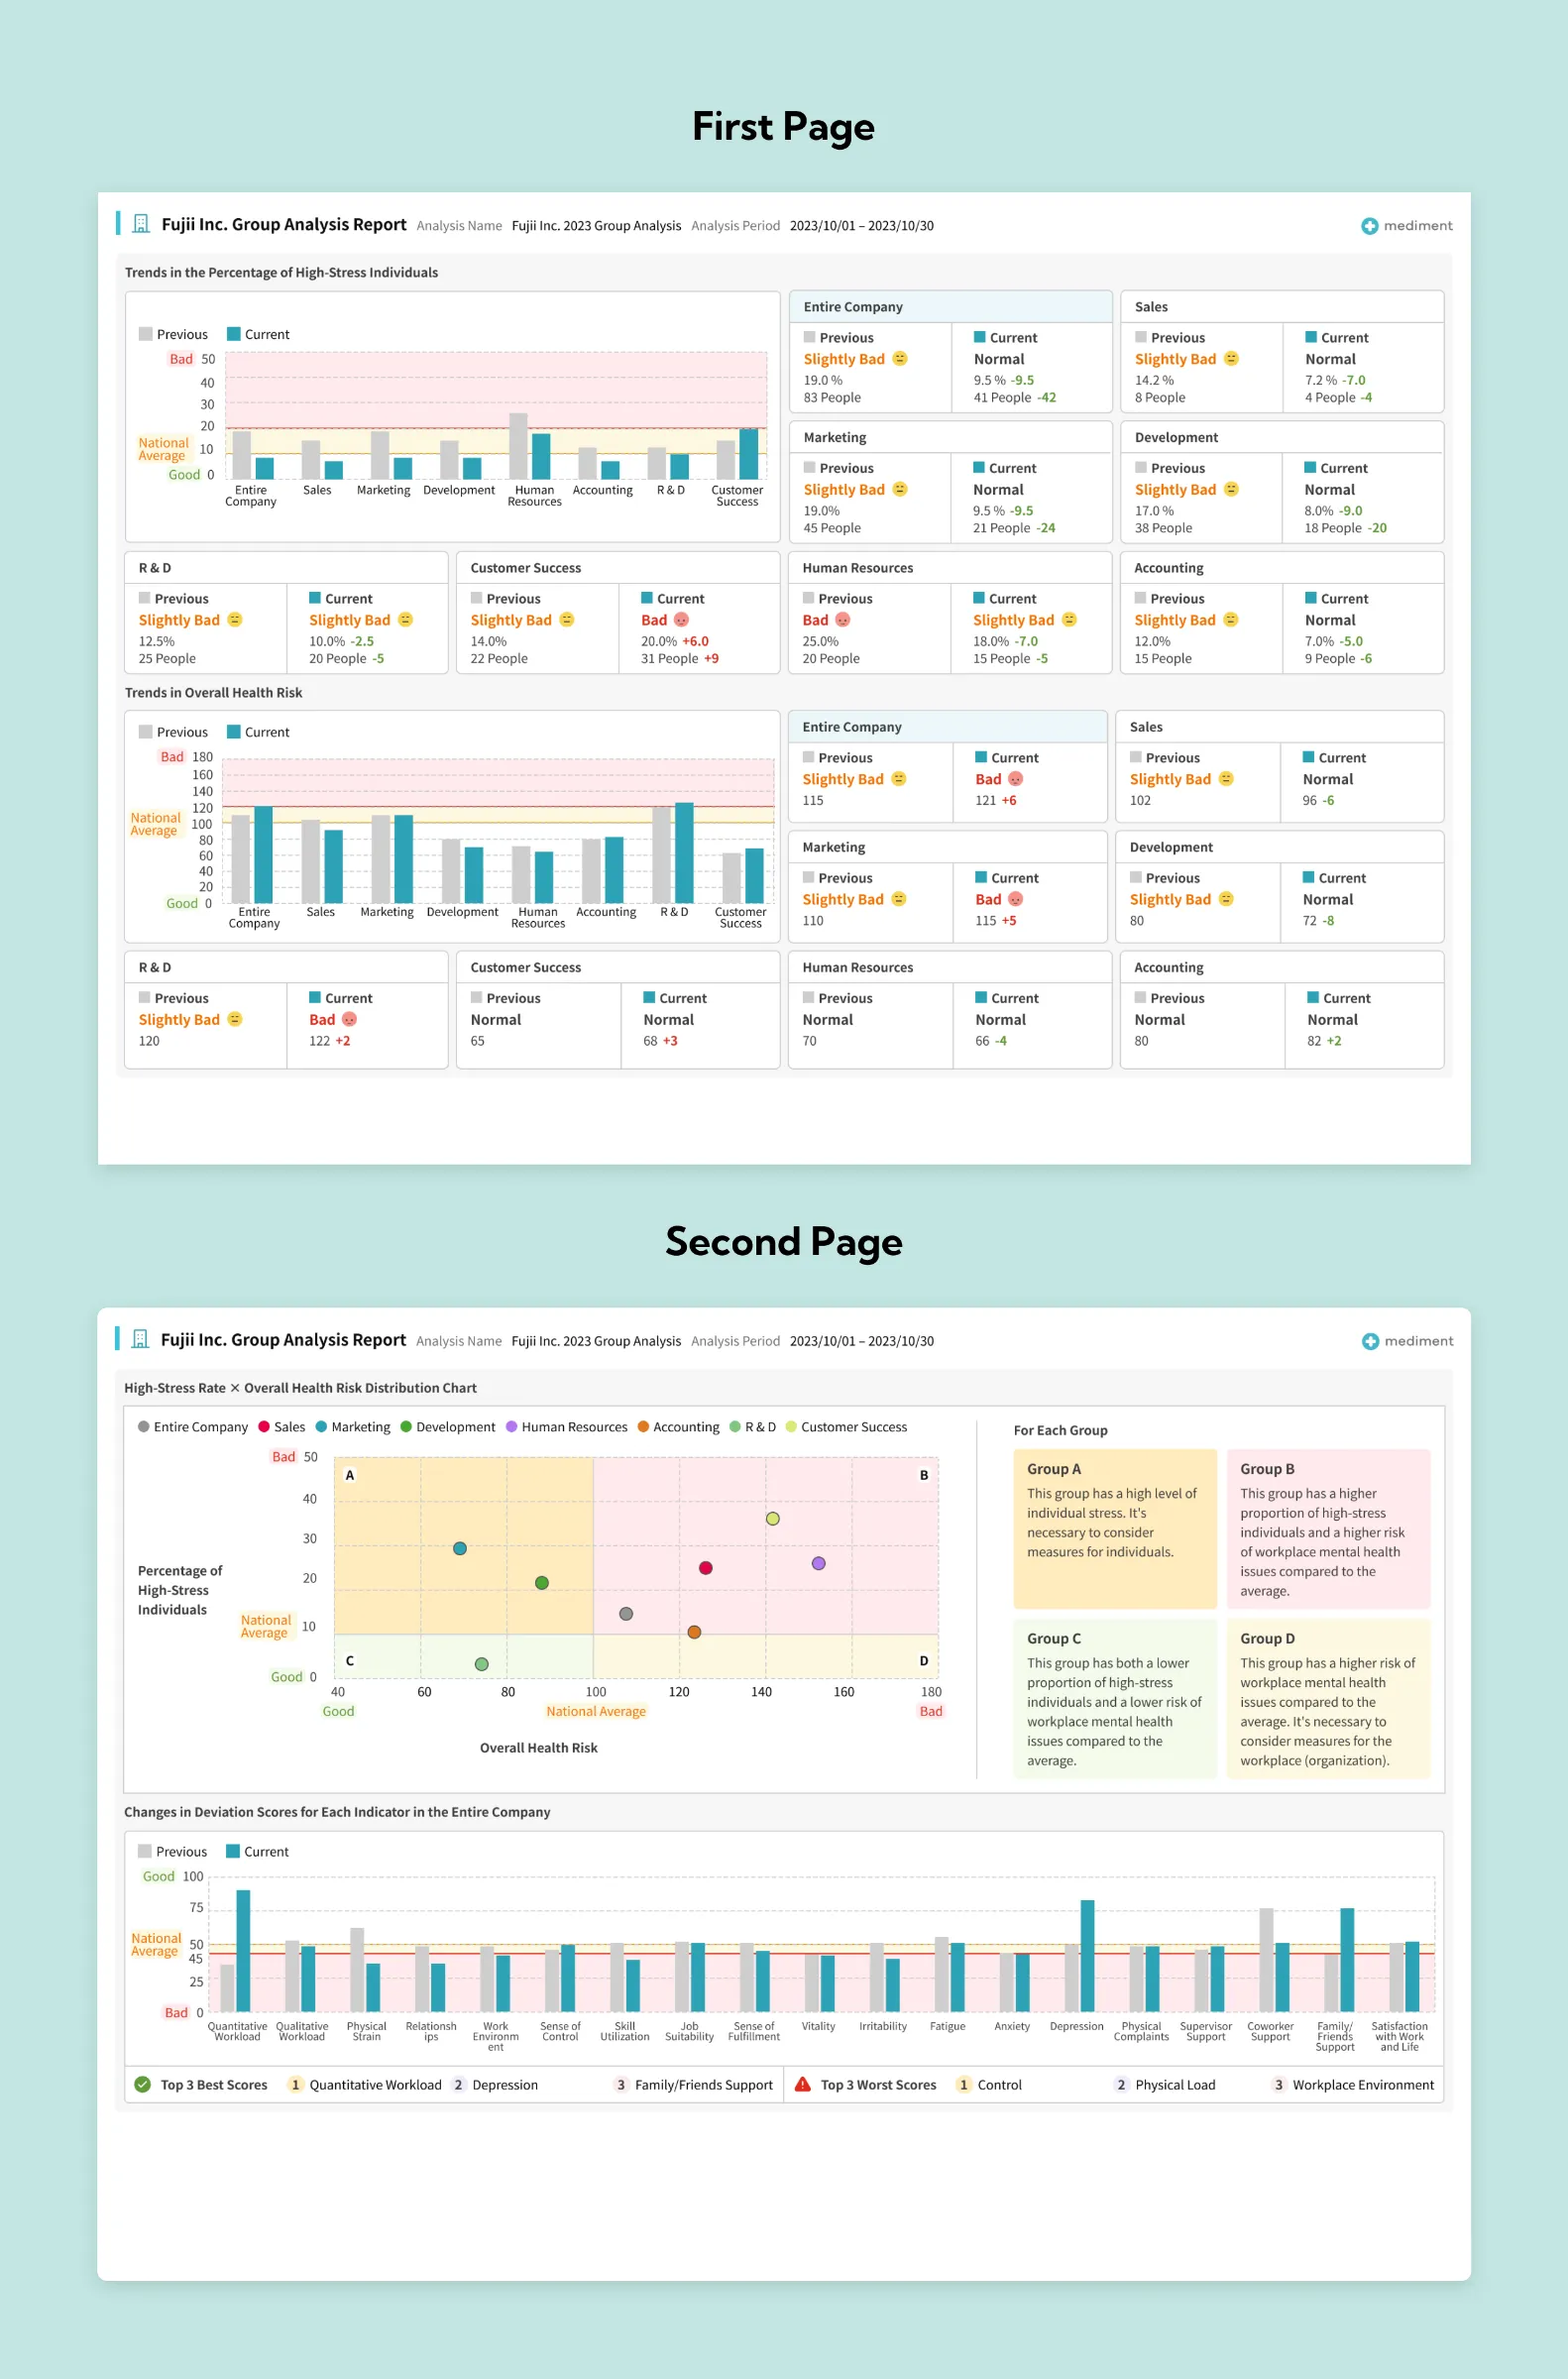
Company-Wide Group Analysis Report (for Executives)
This report includes the results of multiple departments along with the overall company results. The content is mostly the same as the department-level report. However, a key difference is that the second page includes a high-stress rate and health risk portfolio chart, based on feedback from the Workplace Stress Screening Program experts. This addition makes it easier to identify which departments need focused stress management efforts.
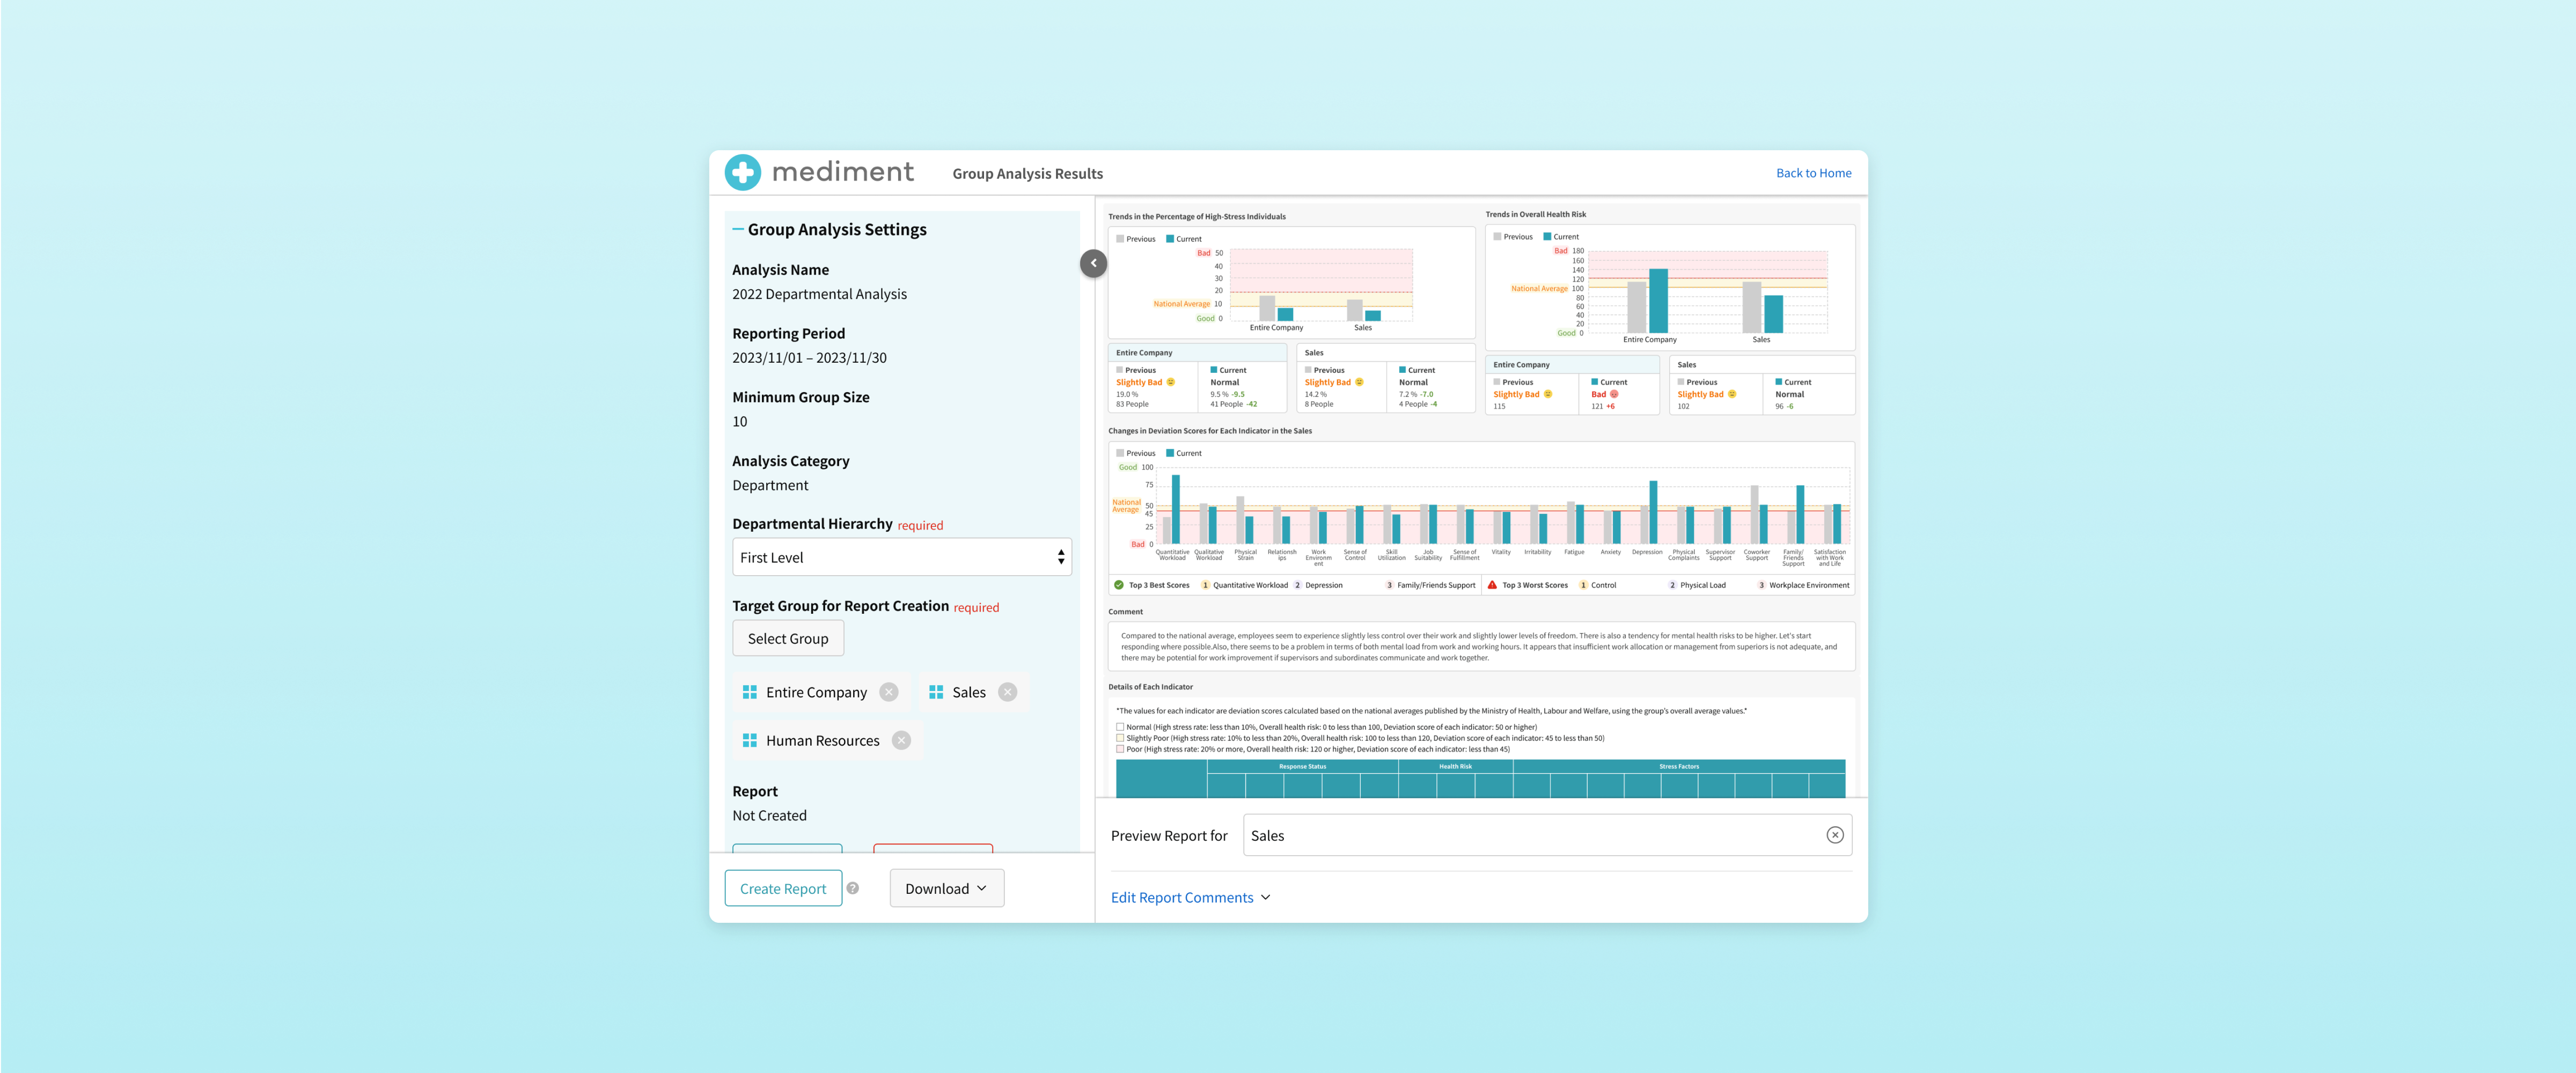
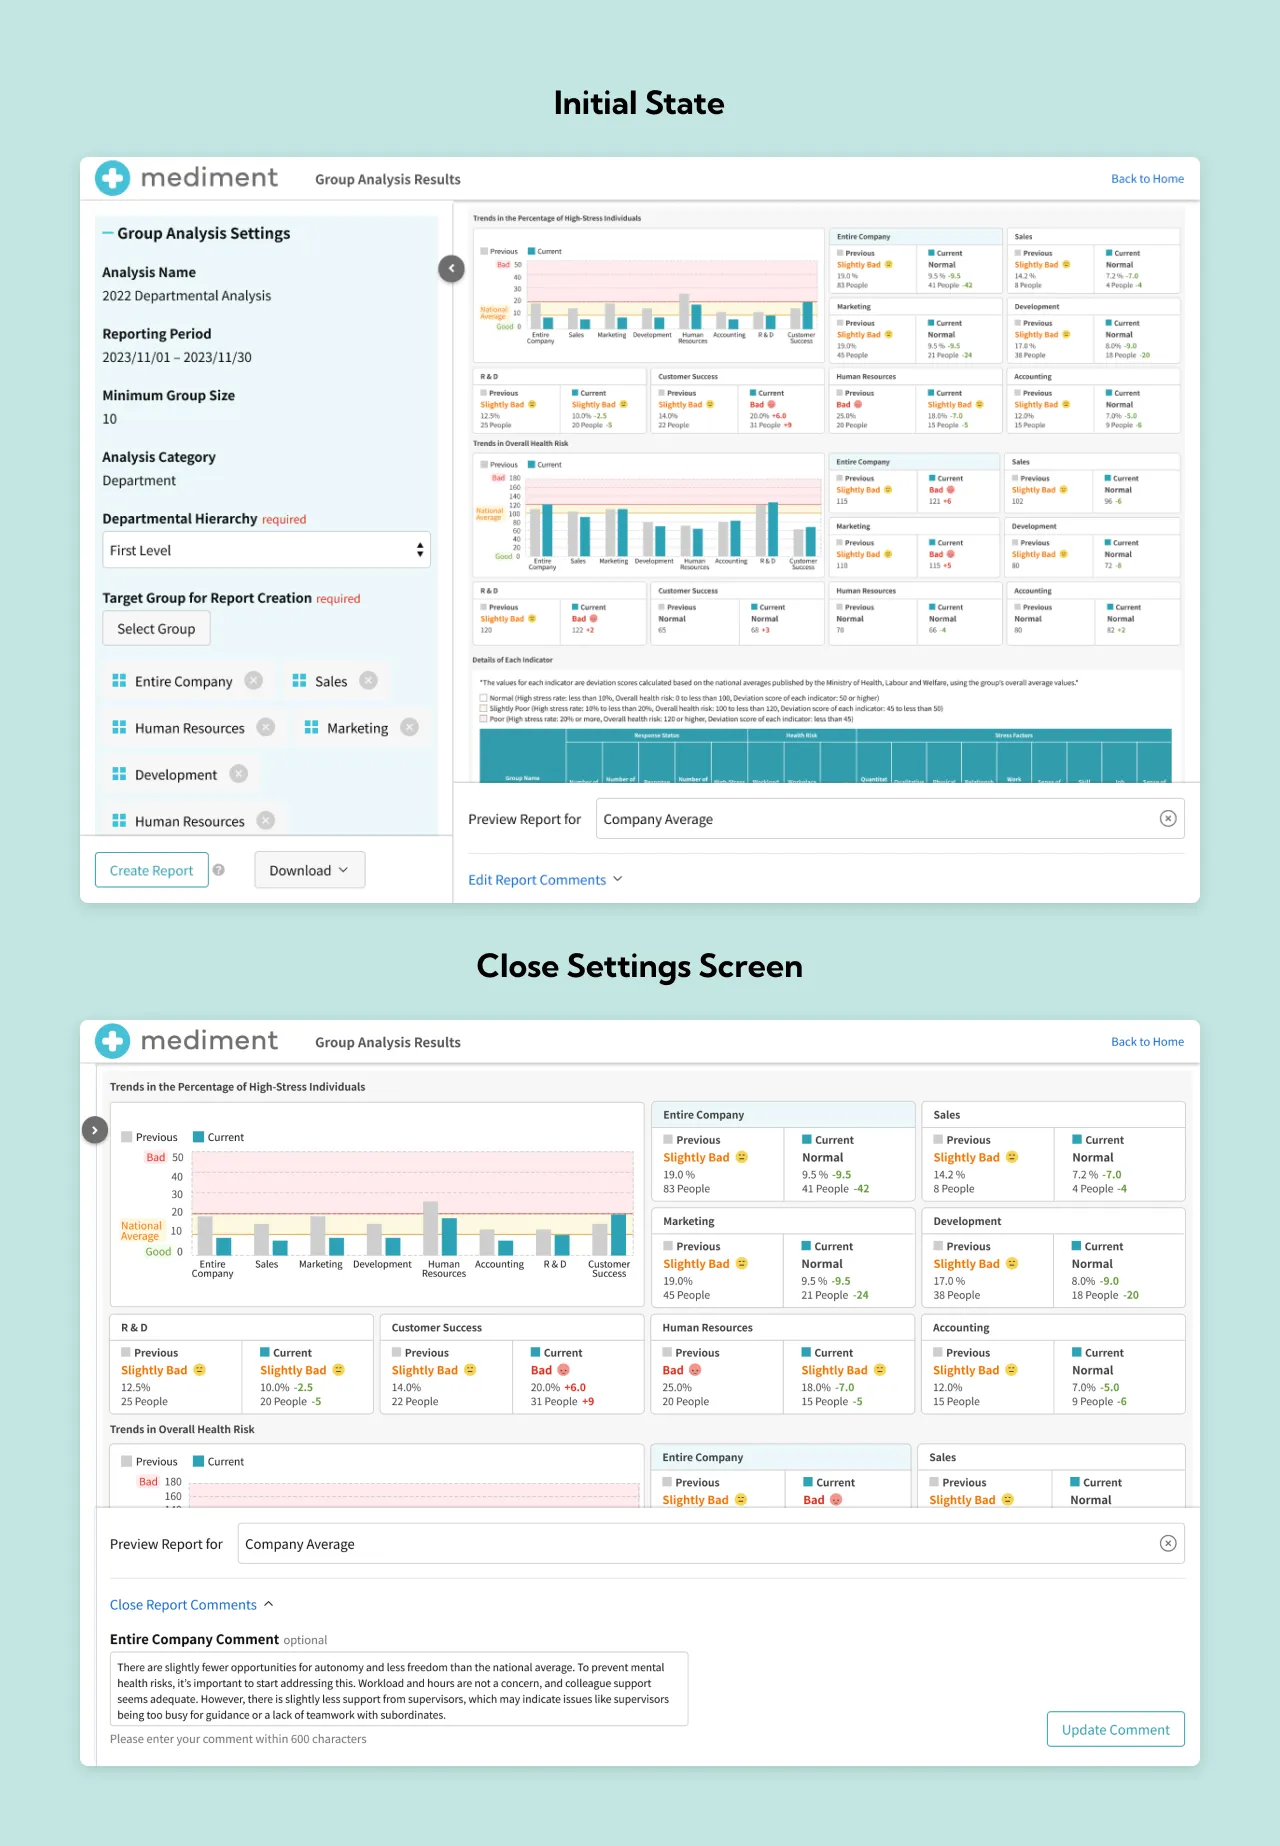
Group Analysis Report Creation Screen
In designing the new report, I also created a new design for the screen where labor manager can generate group analysis reports. The key points are as follows:
- Users can select the groups they want to include in the report while viewing a preview of the report.
- Comments can be entered for each group in the report.
Hi-Fidelity Prototype
I created a Hi-Fi design based on the digital wireframe.
Prototype Link ↗Going Forward
Takeaways
Impact
- The redesign improved usability, addressed key client concerns, and helped prevent the cancellation of 3 major clients.
- Prospective clients expressed interest in switching to our service after reviewing the new design, citing its clear presentation of essential analytical data.
What I learned
- I learned data visualization methods and the roles of different types of graphs through this project.
- It is essential to identify the most important information and prioritize it through collaboration with stakeholders, including domain specialists and the project owner.